Annual Review 2014
2014
Strategy Scorecard
Press the start button to begin your journey or use your keyboard controls as per the diagram below.

Investment Proposition
1
Our customer value proposition enables a
strong and sustainable
competitive advantage...
2
... which drives superior
rates of
economic
returns
(high quality of opportunity)...
3
... and positions us uniquely to deliver superior
levels of growth
(high quantity of opportunity)...

Five-Year Plan
1 Get the basics right:

Invest in product & service quality

Invest in asset management
growth:

Invest in business development to support diversification
2

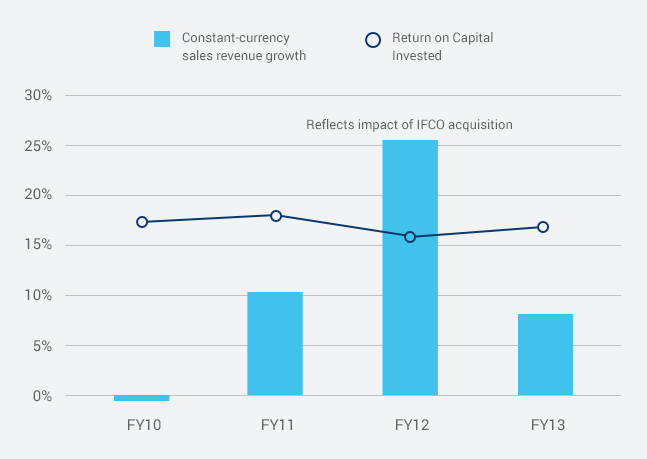
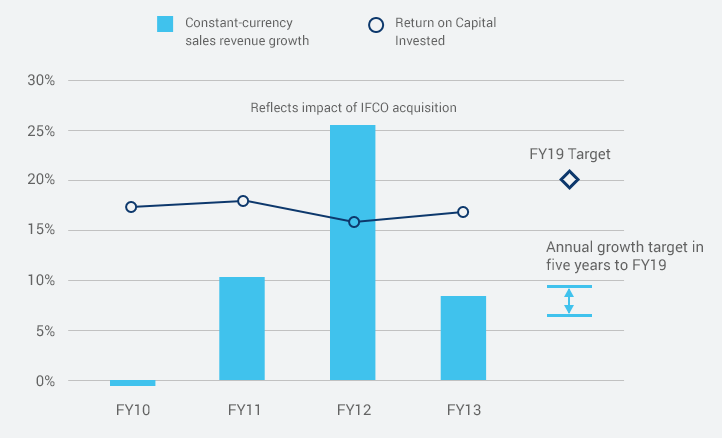
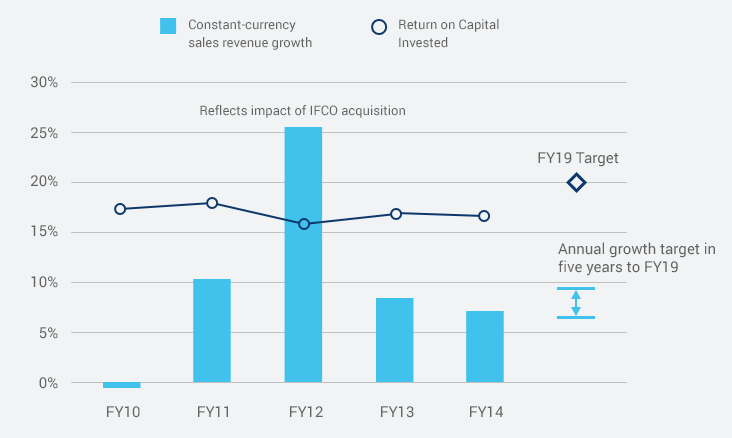
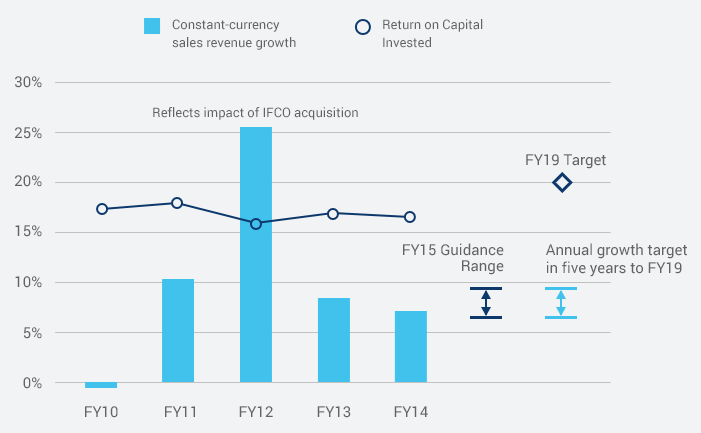
Consistently improve Group Return on Capital Invested to at least 20% by FY19
3

Deliver annual constant-currency percentage sales growth in the high single digits

FY14 Progress
1

Strong progress in asset management efforts in Pallets operations

Continued rool-out of new products and new market expansion

Net new business wins contribute 2% constant-currency sales revenue growth
2

Flat ROCI outcome in FY14 but on track for FY19 target of at least 20%
3

7% constant-currency sales revene growth
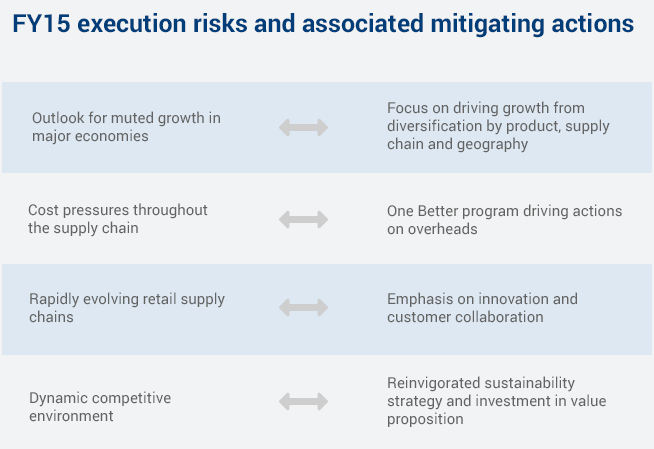
FY15 Expectations
1

One Better program to begin to enable overhead reduction for reinvestment in growth initiatives

Asset management improvements in CHEP Pallets business to drive ongoing capital effeciencies

Continued expansion of under-penetrated opportunities in developed markets, new products and emerging market expansion to drive sales growth
2

Underlying Profit growth forecast at 7-10% (30 June 2014 foreign exchange rates) and improvements in Return on Capital Invested
3

Constant-currency sales revenue expected to be in line with five-year plan